Your Courses All Courses
Dashboards and Analytics

Dashboards and Analytics

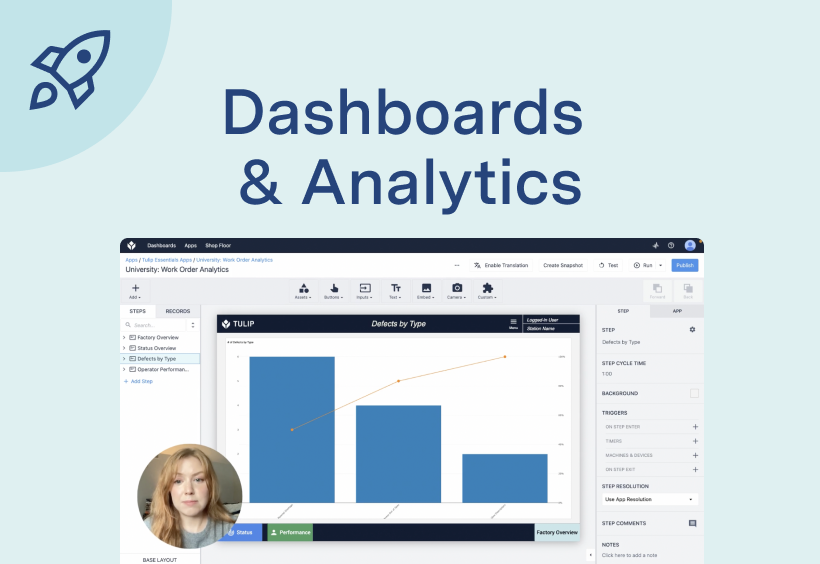
Week 4 — A primer on data visualization with Tulip. Learn to build individual analytics and Dashboards, and incorporate your analytics into dynamic apps for visualizing production.

rate limit

Code not recognized.

Curriculum26 min

  • Course Objective
  • App We'll Build: Work Order Analytics 3 min
  • Add Steps & Logic
  • Create Application Completion Data 3 min
  • Overview
  • Getting Started With the Analytics Builder 2 min
  • Analytics Building
  • Build It: Single Number 7 min
  • Build it: One Operation 5 min
  • Build It: Compare Variables 3 min
  • Build It: Multiple Operations 3 min
  • Analytics Design
  • Format and Style Analytics 1 min
  • Knowledge Check
  • Knowledge Check (Repeatable Quiz)
  • Summary
  • Survey
  • Build on What You Learned